Abstract
Where distribution maps do not exist ecologists often use regional species lists to examine geographic patterns of species richness, despite the fact that inconsistent grain sizes across areas may complicate interpretation of the results.
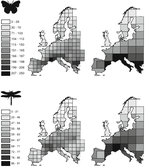
We compare patterns of species richness of European butterflies and dragonflies using regional species lists (varying grain size) and regular grids (constant grain size). We asked if species lists give results comparable to the gridded data when used in simple macroecological analysis of environmental correlates of species richness. We generated two equal-area grids (220 × 220 km and 440 × 440 km) to map the richness gradients and model species richness as a function of actual evapotranspiration (AET) and range in elevation. Then we used species checklists of 33 administrative regions of unequal sizes to construct the same environmental models while accounting for differences in area. Analysis of butterfly checklist data produced comparable results to the analysis of gridded data. In contrast, dragonfly checklist data had a distorted spatial pattern and much weaker associations with environmental variables than the gridded data.
The robustness of checklist data appears to be variable, even within a single geographical region, and may not generate patterns congruent with those found using equal-area grids.